A Geographic Information System (GIS) integrates hardware, software, and data to capture, manage, analyze, and display geographic information. Many organizations use GIS to examine data, answer questions, solve problems and most importantly, make informed decisions in thousands of different situations. For example, government organizations use GIS to track a host of different data from earthquakes to the incidence of heart attacks and strokes and situate this information on maps. One very large benefit of computerized maps is that they can quickly combine information from different sources or layers and display them on the same map.
Example
Let's imagine that there is a sudden outbreak of a water-borne disease like cholera. The Center for Disease Control could create a map with the following layers:
With this information, it would be possible to quickly take measures to quarantine those areas already affected, and inform people about which hospital or community center to go to. You could predict the pathways that the disease may take along rivers and streams, warn the population and prevent access to the water. All of this could be done very quickly to prevent the spread of the disease and to monitor its control.
The key to understanding how computerized maps work, is to understand how the information in the map is structured.
Information in web-based maps is separated into layers. Each layer can have a different set of information. For example, if you were wanting to keep track of forestry data, you would have one layer that showed trees, and another layer for soil types, and yet another for rivers or lakes.
Each layer of the map has features on it, for example the trees on the trees layer and soil types on the soils layer. Each single feature (tree) has information about it in the form of attributes, for example, what species of tree, how old it is, its height, etc. So, although any one tree may be only a dot on the map, that dot contains information about all the attributes of that tree. If you think about all the trees on any map, plus the soil types, rivers, lakes and all their attributes, that is a lot of information.
How is all this information stored in a map? Actually, the information is stored in a database but because this is a computerized map, it can access all the information in not just one, but even multiple databases if it needs to.
Let's return to the single tree and its attributes. If we had to track all the information about the cedar tree, we would enter it in a spreadsheet or database as a single record. Each category of information, for example tree height, is called a Field.
Single Record in a Database
| ID: | Type: | Age: | Height: |
|---|---|---|---|
|
12 |
Cedar |
110 |
67' |
The attributes for a grove of trees would look like this in the database:
Multiple Records in a Database
| ID: | Type: | Age: | Height: |
|---|---|---|---|
|
12 |
Cedar |
110 |
67' |
| 13 |
Pine |
135 |
80' |
| 14 |
Spruce |
120 | 72' |
| 15 |
Cedar |
120 | 70' |
|
16 |
Spruce |
105 | 65' |
|
17 |
Elm |
121 |
75' |
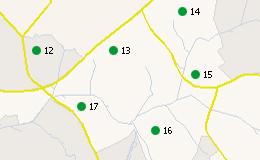
For a grove of trees, we would not only want to track the attributes of each tree but also where each tree is positioned in relation to all the others in the grove. If we plotted their position on a map, it would look something like this:
Mapping Locations
This ability to add spatial data and information (attributes) is the foundation of GIS. A GIS tells us not just where something is but also what it is. Computers make GIS possible as a computer can link maps to a database of information. By using a computer, we can have hundreds of fields (different attributes) for millions of records (trees). For more information about how data is structured in web maps, go to About Layers.
See also...